> ## Documentation Index
> Fetch the complete documentation index at: https://hercules.app/docs/llms.txt
> Use this file to discover all available pages before exploring further.
# Agent analytics
> See how your Hercules Agent is doing: how often it runs, how often it fails, how long it takes, which tools it uses, how it scores, and what it costs.
Agents is in private beta, so things may change. If you hit a problem, tell us via [Support &
feedback](/docs/company/contact).
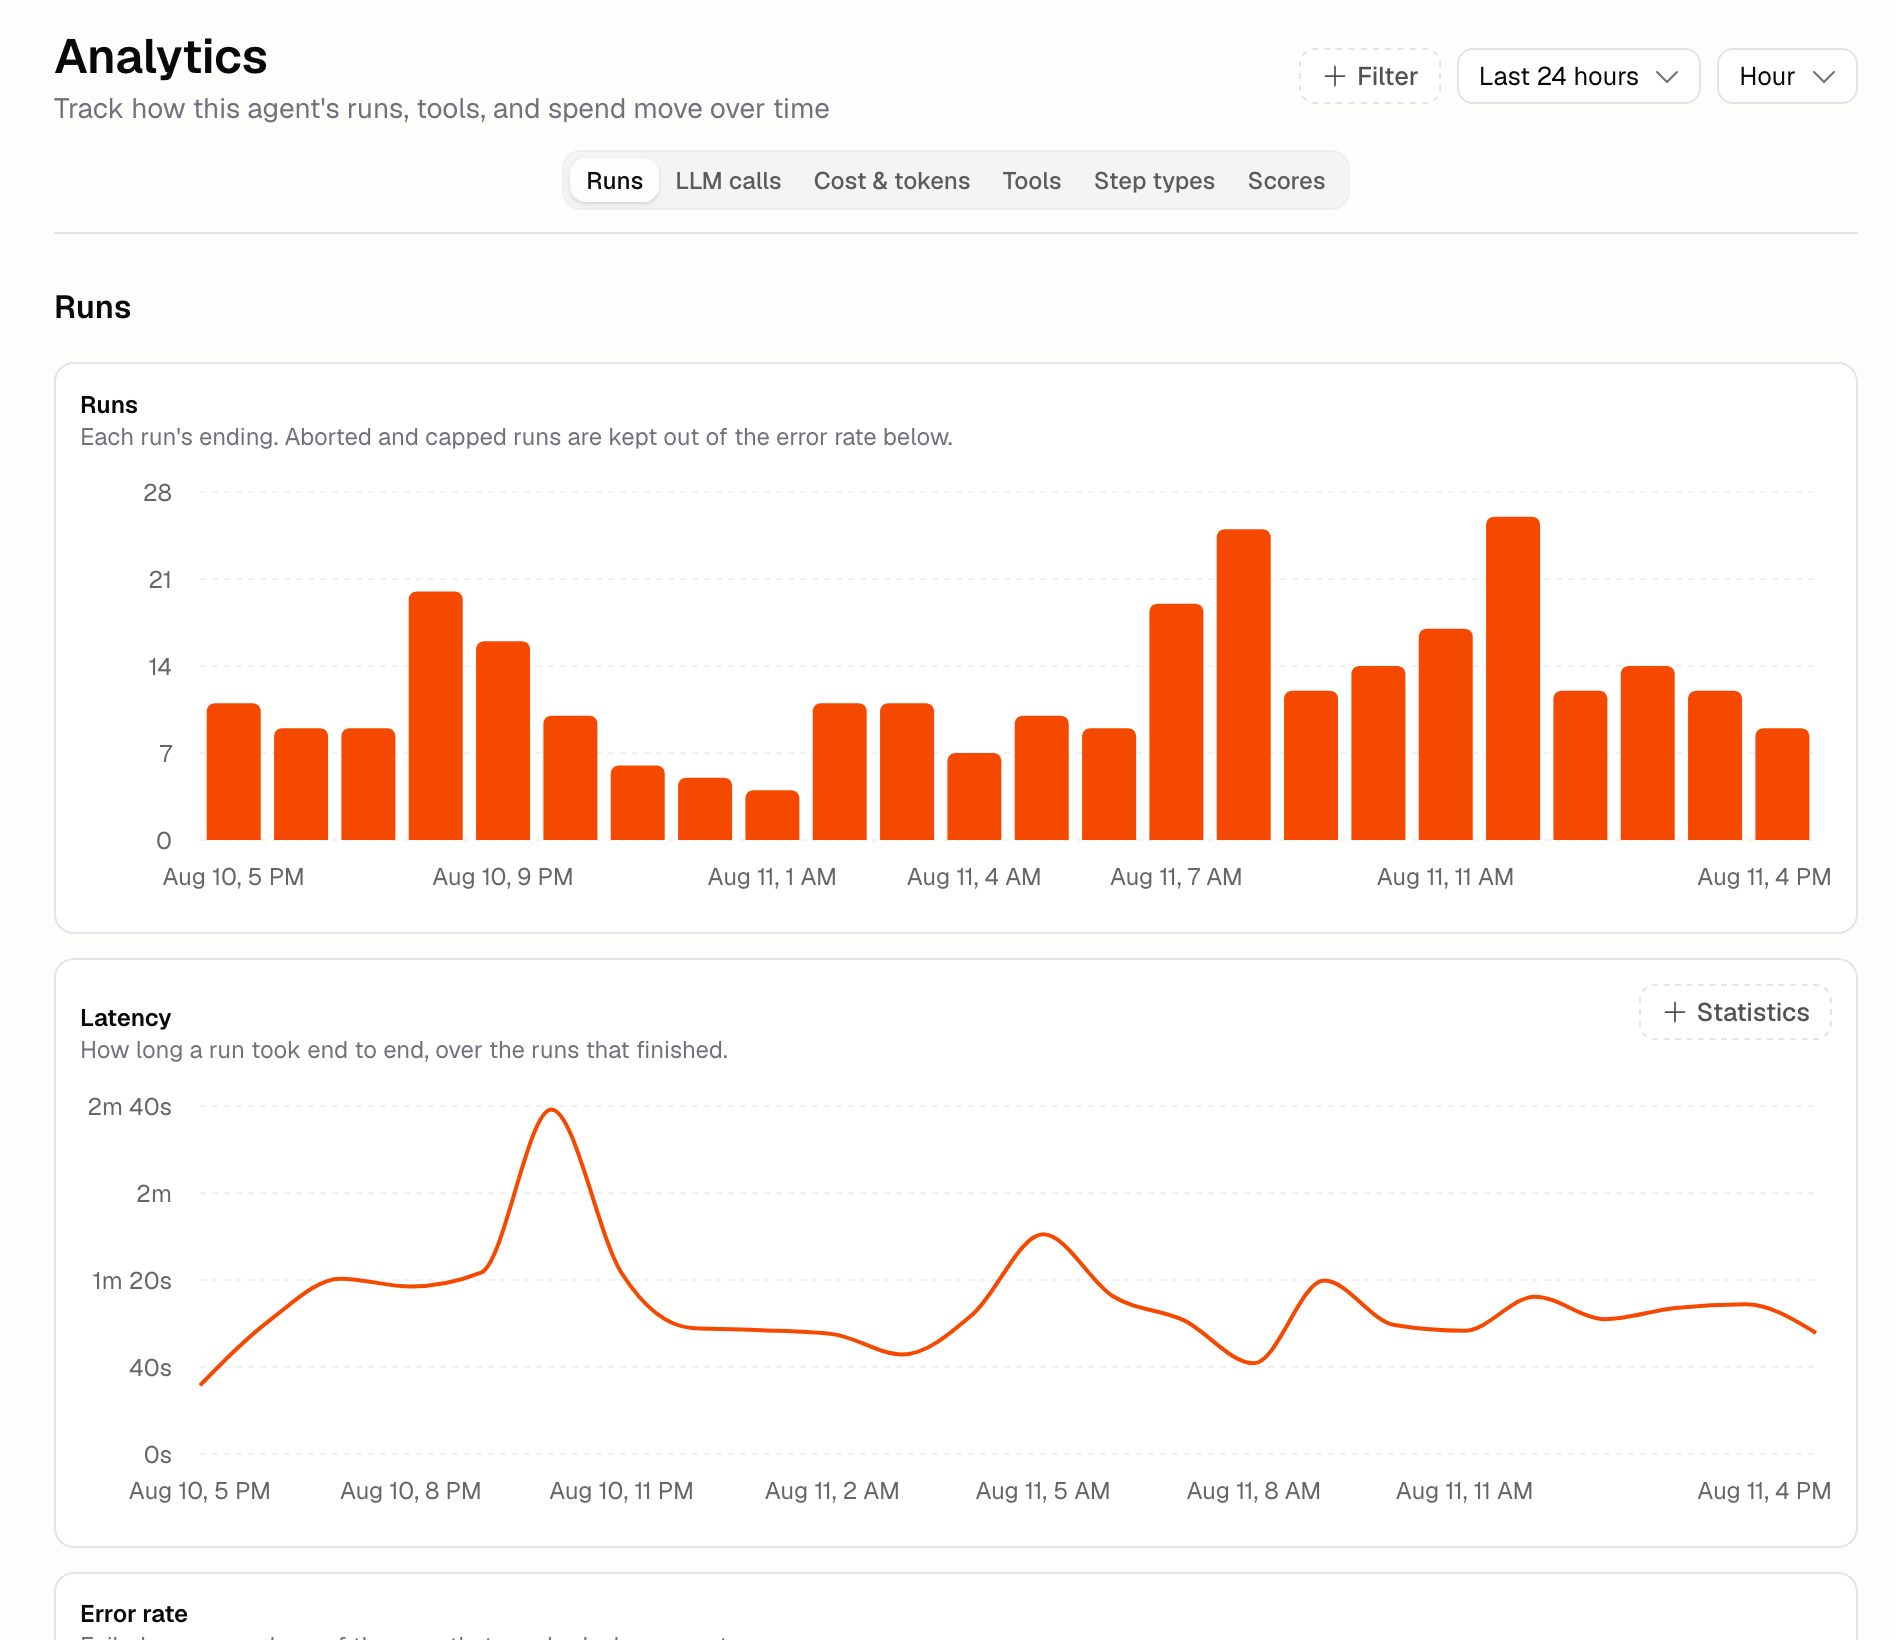
Analytics answers three questions about your Agent: is it running, is it working, and what is it costing?
Go to **Agents** → open an Agent → **Monitor** → **Analytics**.
### What do the charts show?
The page has six sections. Use the tabs at the top to move between them, and the controls beside the heading to change the dates and filter what you see.
| Section | What's in it |
| ----------------- | ---------------------------------------------------------------------------- |
| **Runs** | How many runs, how they ended, how long they took, and how often they failed |
| **LLM calls** | Every time the Agent asked a model something, and how long it waited |
| **Cost & tokens** | Credits per run, total usage, and where your spend is going |
| **Tools** | How often each tool was used, how slow it was, and how often it failed |
| **Step types** | What the Agent's steps were made up of |
| **Scores** | How your Agent is scoring on real runs, and how many were graded |
Runs you stopped yourself, and runs stopped by a limit, don't count as failures, but they're still part of the total the failure rate is measured against. Timings only count runs that finished.
### Why is my spend higher than the runs chart suggests?
Because runs aren't the only thing that costs credits. **Spend by source**, under the Cost charts, splits your spend into runs and everything else: [Auto-improve](/docs/agents/auto-improve), scoring real runs, and run summaries.
The other charts only count runs, so this is where the rest shows up.
### How do I bring costs down?
* Cap a single run under **Build** → **More** → **Run limits**
* Drop the model tier if the Agent's job doesn't need the top one
* Remove tools the Agent doesn't use
* Grade fewer real runs, or turn that off completely
* Put a credit cap on Auto-improve
See [Costs and limits](/docs/agents/costs-and-limits).
### Additional FAQ
A run that finished and failed. Runs you stopped yourself, and runs stopped by a limit, aren't
counted as failures, though they're still in the total the rate is measured against. Only runs
that never reached a known ending are left out altogether.
On the [AI Credits](/docs/platform/billing/ai-credits) page. Analytics only covers one Agent.
Open a slow run in [Run history](/docs/agents/run-history) and read back through its steps. You'll see
whether the time went on the model or on one of the tools, and the **Tools** section here shows
which tool is slow across every run.
Nothing has graded a real run yet. Turn on grading for a [scorer](/docs/agents/scorers) that doesn't
need an expected answer.